

MOAF publishes 2012 league tables
Manchester Office Agents' Forum has published its annual league tables showing the letting and sales performance of the top office agents in the city centre and out-of-town markets as well as total take-up figures for the year.
Take-up for 2012 was 788,265 sq ft in Manchester city centre and 660,829 sq ft in South Manchester. By comparison office take-up in Manchester city centre during 2011 totalled 700,000 sq ft compared with 1.32m sq ft during 2010. In the out-of-town market, take-up was 935,252 sq ft in 2011 compared with 864,938 sq ft in 2010.
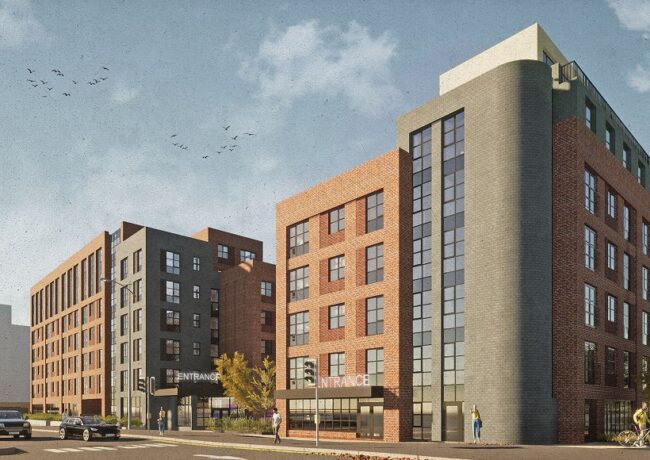
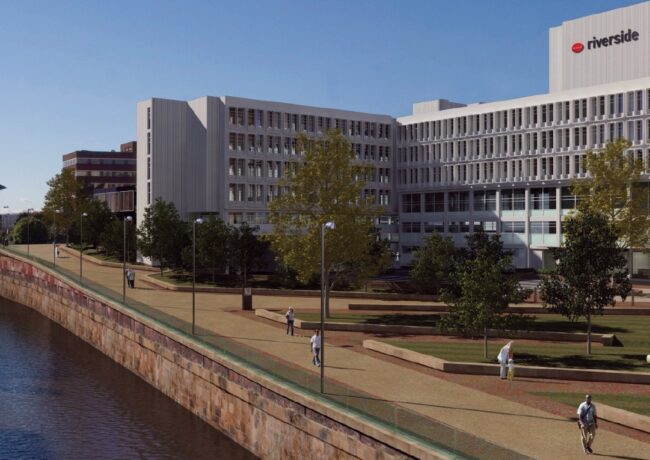
Deal activity in 2012 across central Manchester improved with more deals completed, although there was a lack of large transactions. Bruntwood's Riverside performed strongly leasing in excess of 80,000 sq ft with large deals to Futureworks, 24,000 sq ft, and MoneyPlus Group, 21,500 sq ft. Other notable transactions for the year included i2 serviced offices taking 22,000 sq ft at 3 Hardman Square and HBG taking 20,000 sq ft at Chancery Place.
South Manchester performed strongly with take-up boosted by Micromass Waters' commitment to a new 100,000 sq ft facility at Wilmslow Office Park and the Blemain Group's 50,000 sq ft freehold acquisition at Cheadle Royal Business Park.
Old Trafford enjoyed one of its busiest years with take-up totalling 245,000 sq ft, the largest letting being Think Money's relocation to new purpose-built offices comprising 125,000 sq ft. The business will relocate from Salford Quays which struggled at 85,523 sq ft for the year despite a large letting to Vital Services Group of 19,499 sq ft in November.
Emma Powell, assistant surveyor at, OBI Property and spokesman for MOAF, said: "2012 proved a really positive year in light of the continuing tough market conditions in respect of the office market throughout the Manchester region. Once again Manchester has outperformed all other regional cities.
"When considering the lack of large transactions in the city centre, the fact that take up reached such a positive level close to 800,000 sq ft is testament to the resilience and strength of the local economy. Interestingly the number of deals were up 43% in comparison to 2011 in the city centre and 2013 is already looking like another busy year with a number of large deals already happening. We are seeing signs of inward investment to the region increasing during the next 12 months and this will further enhance the performance of the regions property market."
|
Area |
Q1 Size sq ft |
Q2 |
Q3 |
Q4 |
2012 |
|
Manchester City Centre |
169,891 |
141,133 |
179,930 |
297,311 |
788,265 |
|
South Manchester |
119,695 |
161,453 |
258,134 |
175,317 |
660,829 |
|
Old Trafford |
39,829 |
171,588 |
15,156 |
18,884 |
245,457 |
|
Salford Quays |
10,099 |
19,357 |
6,244 |
49,823 |
85,523 |
MOAF Office Agent League Tables
|
City Centre League Tables |
|||
|
League Table By Deals |
|||
|
Position |
Company |
Number of Deals |
% |
|
1 |
Edwards & Co |
78 |
29% |
|
2 |
OBI |
66 |
24% |
|
5 |
Jones Lang LaSalle |
59 |
22% |
|
3 |
Canning O'Neill |
59 |
22% |
|
4 |
WHR |
52 |
19% |
|
6 |
CBRE |
40 |
15% |
|
7 |
LSH |
38 |
14% |
|
8 |
DTZ |
34 |
13% |
|
9 |
Savills |
12 |
4% |
|
10 |
Knight Frank |
10 |
4% |
|
11 |
Colliers |
8 |
3% |
|
12 |
GVA |
7 |
3% |
|
13 |
P3 |
5 |
2% |
|
14 |
M&G |
5 |
2% |
|
15 |
Cushman & Wakefield |
3 |
1% |
|
16 |
DJ Deloitte |
2 |
1% |
|
League Table By Space Let/Acquired |
|||
|
Position |
Company |
Space Let |
% |
|
1 |
JLL |
249,596 |
32% |
|
2 |
OBI |
239,734 |
30% |
|
3 |
Edwards & Co |
200,133 |
25% |
|
4 |
WHR |
165,911 |
21% |
|
5 |
CBRE |
142,372 |
18% |
|
7 |
LSH |
127,652 |
16% |
|
6 |
Canning O'Neill |
114,595 |
15% |
|
8 |
Savills |
101,783 |
13% |
|
9 |
DTZ |
99,037 |
13% |
|
10 |
GVA |
38,955 |
5% |
|
11 |
Colliers |
30,609 |
4% |
|
12 |
Knight Frank |
29,152 |
4% |
|
13 |
M&G |
23,970 |
3% |
|
14 |
Cushman & Wakefield |
20,589 |
3% |
|
15 |
P3 |
11,060 |
1% |
|
16 |
DJ Deloitte |
2,087 |
0% |
|
Out of Town League Tables |
|||
|
(including South Manchester, Salford Quays and Old Trafford) |
|||
|
League Table By Deals |
|||
|
Position |
Company |
Number of Deals |
% |
|
1 |
Canning O'Neill |
104 |
31% |
|
2 |
Edwards & Co |
58 |
17% |
|
5 |
Jones Lang LaSalle |
36 |
11% |
|
3 |
DTZ |
25 |
7% |
|
4 |
CBRE |
23 |
7% |
|
6 |
Lambert Smith Hampton |
18 |
5% |
|
7 |
Savills |
17 |
5% |
|
8 |
GVA |
13 |
4% |
|
8 |
WHR |
13 |
4% |
|
9 |
P3 |
8 |
2% |
|
9 |
M&G |
8 |
2% |
|
12 |
Knight Frank |
4 |
1% |
|
13 |
Colliers |
3 |
1% |
|
14 |
Cushman & Wakefield |
2 |
1% |
|
15 |
OBI |
1 |
0% |
|
16 |
TSG |
1 |
0% |
|
League Table By Space Let/Acquired |
|||
|
Position |
Company |
Space Let |
% |
|
1 |
Jones Lang LaSalle |
277,075 |
20% |
|
2 |
Canning O'Neill |
271,836 |
19% |
|
3 |
Lambert Smith Hampton |
176,442 |
13% |
|
4 |
DTZ |
169,096 |
12% |
|
5 |
Edwards & Co |
154,216 |
11% |
|
7 |
GVA |
85,470 |
6% |
|
6 |
CBRE |
74,279 |
5% |
|
8 |
Savills |
51,546 |
4% |
|
9 |
WHR |
40,677 |
3% |
|
10 |
Matthews & Goodman |
24,574 |
2% |
|
11 |
Cushman & Wakefield |
20,813 |
1% |
|
15 |
Knight Frank |
18,080 |
1% |
|
12 |
Colliers |
12,819 |
1% |
|
13 |
TSG |
11,665 |
1% |
|
14 |
P3 |
9,836 |
0% |
|
16 |
OBI |
3,249 |
0% |
The Manchester Office Agents Forum exists to promote better knowledge of the Manchester City Region office market providing accurate market statistics and informed market commentary.
Formed in 2009 its' current members include CBRE, Canning O'Neill, Colliers International, Cushman & Wakefield, DTZ, Drivers Jonas Deloitte, Edwards & Co, GVA, Jones Lang LaSalle, Knight Frank, Matthews and Goodman, Lambert Smith Hampton, OBI Property, P3 Property Consultants, Savills, TSG Property and WHR.