

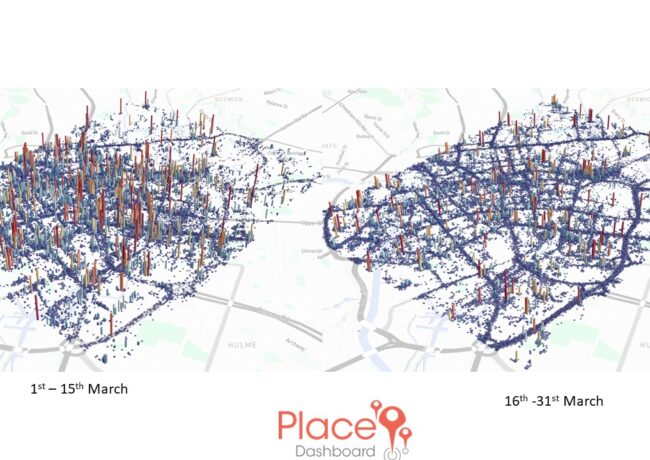
Heatmaps show how city centre went cold
The amount of people visiting Manchester city centre fell by 70% from the first two weeks of March to the second two weeks after restrictions on movement were brought in, according to a series of heatmaps produced by Place Dashboard, a shopper behaviour analyst based at Manchester Science Park.
An interactive downloadable map can be viewed on the Place Dashboard website tracking movement week by week. It shows how Manchester Town Hall Extension offices stayed open as the vital public sector hub does its job while offices at nearby One St Peter’s Square went quiet.
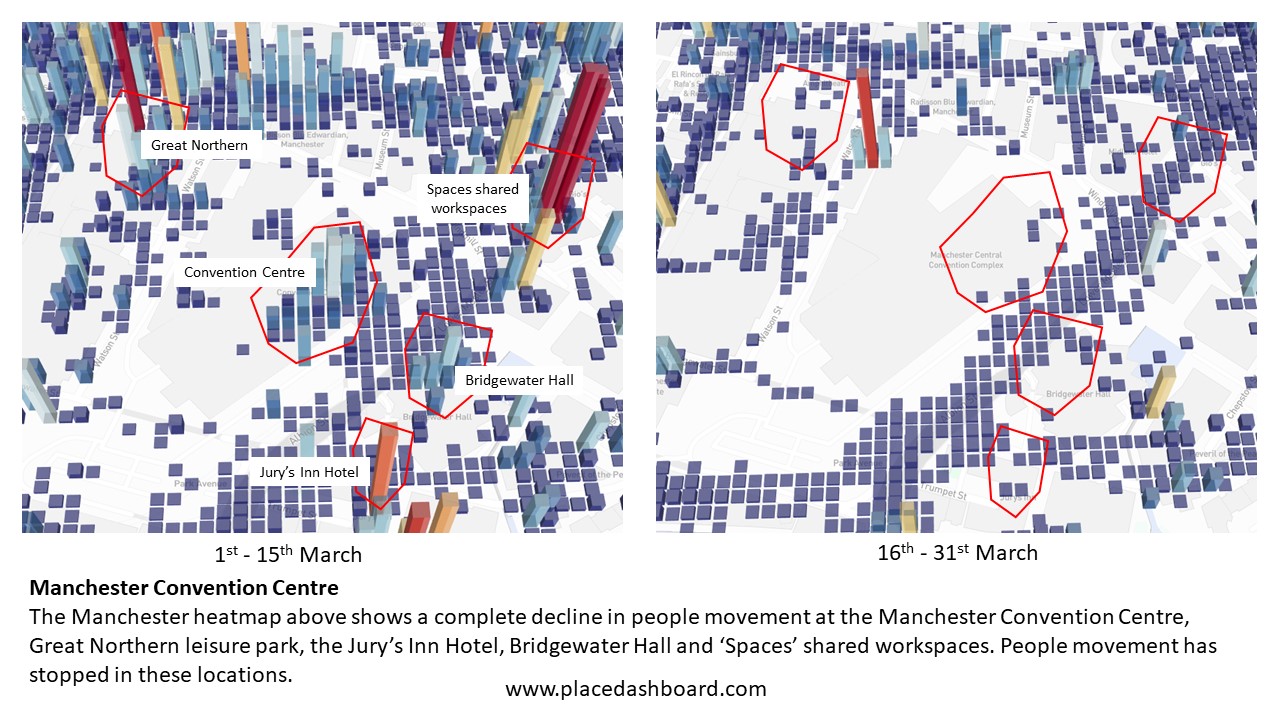
PlaceDashboard is able to measure social distancing by tracking GPS location data captured from mobile phones. The analyst, part of the Mi-IDEA start-up cohort at MSP, is able to track precise movement patters across an entire city centre and identify where the volume of movement activity has changed when two periods of time are compared against each other.
Click to enlarge
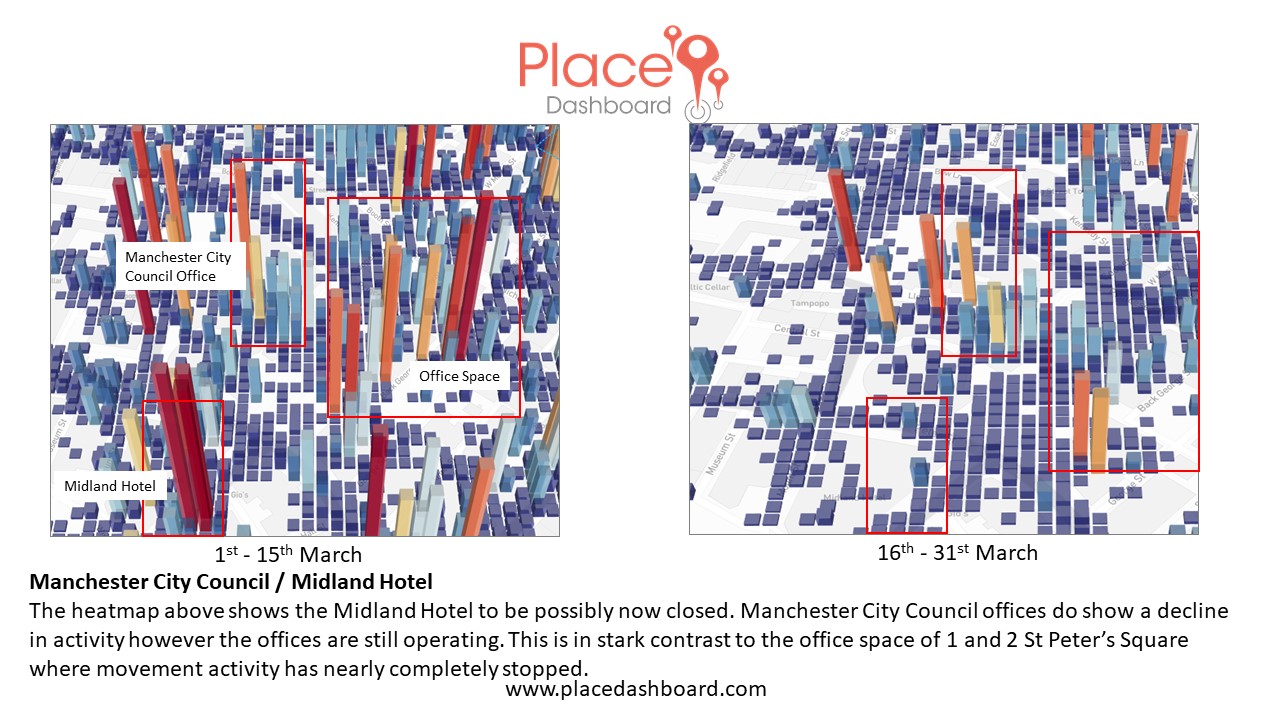
The heatmaps produced were calculated using the period 1-15 March 2020 compared against the period 16-31 March 2020.
Click to enlarge