
English Housing Survey hits 50-year landmark
To mark the 50th anniversary of the English Housing Survey, the Department for Communities & Local Government and the Building Research Establishment have compiled a report comparing the findings of what was the world’s first national housing survey with the modern day housing situation.
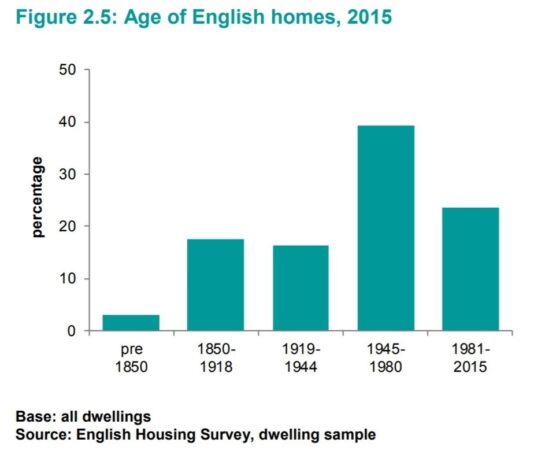
Of the 14.8m homes in England in 1967, 14.4m are still part of the housing stock – following widespread slum clearance programmes of the immediate post-War era, more emphasis has been placed on improving existing stock since the survey began.
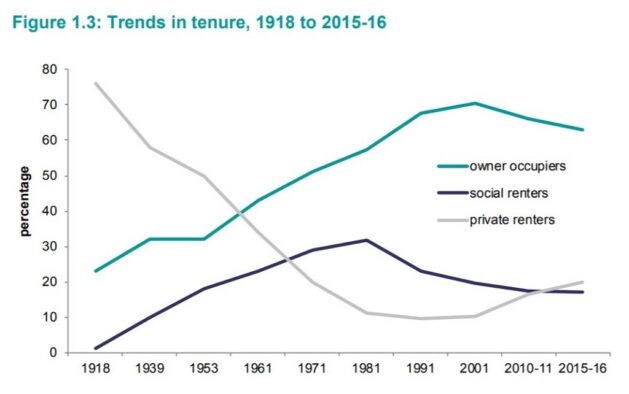
Tenure has remained a major focus for policymakers throughout the 50-year period. In 1951, 51% of stock was owner-occupied, with 29% socially rented and 20% private-rented. Fifty years later, 63% is in owner-occupation, with 17% social housing and 20% private rented, a headline figure that misses the more recent increase of the private rented market.
Standards, unsurprisingly, have risen. In 1967, a quarter of houses were lacking at least one of these measures: a bath or shower, indoor WC, wash hand basin, hot and cold water at three points. By 1991, this figure was 1% and is now so small as to be nearly unmeasurable.
The survey now examines the performance and energy efficiency of houses, something lacking from early years. However, other sources say that in 1961, 76% of homes used solid fuel for heating, with insultation virtually zero. Those figures were virtually reversed by 2015, with less than 1% using solid fuel as their main source of heat and 95% and 98% respectively having some double glazing or loft insulation.
Average household size has decreased since the 1960s, from an average of 3.0 people in the 1961 census to 2.4 in 2015-2016. The proportion of households containing either one or two people increased from 43% to 64% over this period.
The proportion of under-occupied – defined as having two or more spare bedrooms – homes in the owner-occupied sector has risen over the last 20 years, from 31%, 6.2m homes in 1995-96, to 37%, or 8.5m homes, in 2015-16.
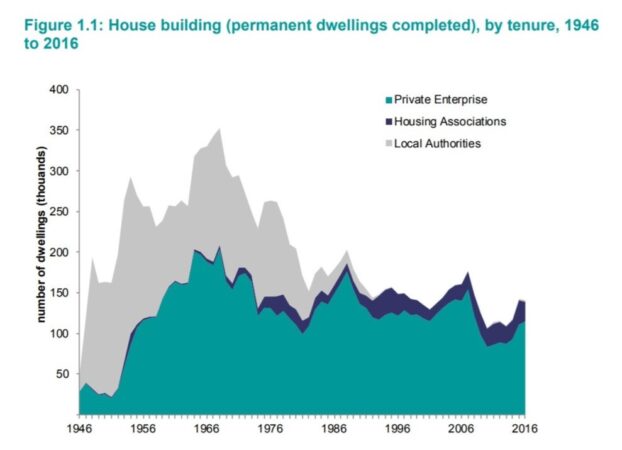
The challenge facing policymakers today is stark, with the report stating that annual average net additions to housing stock were 223,700 in the decade to 1971 and 166,000 in the ten years to 2016.
Full details of the current survey and the 1967 English Housing Survey are available here.
Related Articles